pythonscikit-learnpcalda
Plot the convex hull in PCA and LDA plot - Python
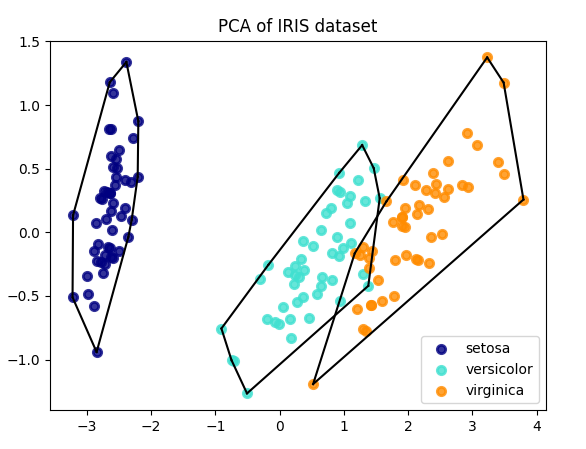
In the code below there is an example of an Principal Components Analysis (PCA) and Linear discriminant analysis (LDA) plots based on the Iris dataset. How can I add to each group its convex hull?
Code:
import matplotlib.pyplot as plt

from sklearn import datasets
from sklearn.decomposition import PCA
from sklearn.discriminant_analysis import LinearDiscriminantAnalysis

iris = datasets.load_iris()

X = iris.data
y = iris.target
target_names = iris.target_names

pca = PCA(n_components=2)
X_r = pca.fit(X).transform(X)

lda = LinearDiscriminantAnalysis(n_components=2)
X_r2 = lda.fit(X, y).transform(X)

# Percentage of variance explained for each components
print('explained variance ratio (first two components): %s'
      % str(pca.explained_variance_ratio_))

plt.figure()
colors = ['navy', 'turquoise', 'darkorange']
lw = 2

for color, i, target_name in zip(colors, [0, 1, 2], target_names):
    plt.scatter(X_r[y == i, 0], X_r[y == i, 1], color=color, alpha=.8, lw=lw,
                label=target_name)
plt.legend(loc='best', shadow=False, scatterpoints=1)
plt.title('PCA of IRIS dataset')

plt.figure()
for color, i, target_name in zip(colors, [0, 1, 2], target_names):
    plt.scatter(X_r2[y == i, 0], X_r2[y == i, 1], alpha=.8, color=color,
                label=target_name)
plt.legend(loc='best', shadow=False, scatterpoints=1)
plt.title('LDA of IRIS dataset')

plt.show()
Solution
Using SciPy you can plot the convex hull of points quite easily.
hull = ConvexHull(X_r)
for simplex in hull.simplices:
    plt.plot(X_r[simplex, 0], X_r[simplex, 1], 'k-')
If you want to do this for each group individually, you can modify the code and change X_r to the respective subset containing your desired points. This would be the following for your snippet:
for color, i, target_name in zip(colors, [0, 1, 2], target_names):
    plt.scatter(X_r[y == i, 0], X_r[y == i, 1], color=color, alpha=.8, lw=lw,
                label=target_name)

    hull = ConvexHull(X_r[y == i])
    for simplex in hull.simplices:
        plt.plot(X_r[y==i][simplex, 0], X_r[y==i][simplex, 1], 'k-')
For your first plot this would give the following result: