Plot timeline in R as single labeled bar and with dates at the x-axis labels
I want to create a nice timeline plot using the timeline package in R, but I am not sure how to fix these issues I am having with it. One is that these bars stack upwards, but I'd like them to be on the same level. The y-axis should be left out. The x-axis should use the labels from the StartLabel column. How do I get it there?
Here is the code and data:
require(data.table)
require(timeline)

setsTimeline <- data.table(Set=c("x","y","z","x","y","z","x","y","z","x","y","z","x"),
       StartDate=c(1380708900,1402963200,1420070400,1421280000,1410912000,1396310400,1397520000,1418860800,1404172800,1405382400,1395100800,1412121600,1413331200),
       EndDate=  c(1395099900,1404171900,1421279100,1430985600,1412120700,1397519100,1402962300,1420069500,1405381500,1410911100,1396309500,1413330300,1418859900))

setsTimeline[,StartLabel:=as.POSIXct(StartDate,tz="UTC",origin="1970-01-01")]
setsTimeline[,Group:=c("Timeline")]
setkey(setsTimeline,StartDate)

timeline(setsTimeline,label.col="Set",start.col="StartDate",end.col="EndDate",group.col="Group")
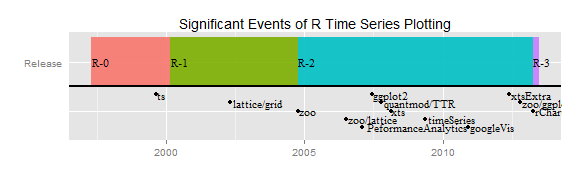
Something like this is what I'd like to see: http://timelyportfolio.github.io/rCharts_time_series/assets/fig/unnamed-chunk-3.png
But now it looks like this:

Edit:
So maybe this is a lost cause, because this package is just not finished yet.
I did manage to get the graph unstacked. It appears one has to define a group variable.
But still I am unable to figure out how to change the labels and add a legend. It appears this plot does not respond to the usual plot functions.
I edited the code above and here is the current graph:

So apparently the thing I wanted to do is even possible with just ggplot2, so I am wondering why someone is even bothering creating a new package for it. I spent a few more hours trying to find the right options and stuff but here goes:
require(data.table)
require(ggplot2)
require(grid)

setsTimeline <- data.table(Set=c("x","y","z","x","y","z","x","y","z","x","y","z","x"),
       StartDate=c(1380708900,1402963200,1420070400,1421280000,1410912000,1396310400,1397520000,1418860800,1404172800,1405382400,1395100800,1412121600,1413331200),
   EndDate=  c(1395099900,1404171900,1421279100,1430985600,1412120700,1397519100,1402962300,1420069500,1405381500,1410911100,1396309500,1413330300,1418859900))

setsTimeline[,StartLabel:=as.POSIXct(StartDate,tz="UTC",origin="1970-01-01")]

breaks <- c(1380708900,1395100800,1402963200,1410912000,1418860800,1430985600)
labels <- as.POSIXct(breaks,tz="UTC",origin="1970-01-01")

ggplot(setsTimeline, aes(colour=Set)) +
  geom_segment(aes(x=StartDate, xend=EndDate, y="group", yend="group"), size=10) +
  theme(panel.grid.major = element_blank(),
    panel.grid.minor = element_blank(),
    panel.background = element_blank(),
    aspect.ratio=5e-02,
    axis.text.x = element_text(colour='black', angle = 45, size = 16, hjust = 1, vjust = 1),
    legend.text = element_text(colour='black', size = 16),
    legend.title = element_text(colour='black', size = 0),
    legend.position = 'top',
    plot.title = element_text(colour='black', size = 18),
    panel.margin = unit(1, "cm")) +
  xlab(NULL) +
  ylab(NULL) +
  ggtitle("Data timeline with marked sets") +
  coord_cartesian(xlim = c(1380708900,1430985600), ylim = NULL) +
  scale_x_continuous(breaks=breaks,labels=labels)
results in:

if someone comes by who knows how to get rid of the y-axis and how to get the first x-axis label to remain within the plot area without having to move/turn it, please help me out. I tried plot.margin and panel.margin, but one did nothing and the other kept erroring out.
it is now way past my bedtime and I have a presentation to give tomorrow...
- rintrojs only shows first dialog in Safari
- Automatically read a column of lowercases True and False as logical
- How do I add counts to a stacked bar graph?
- Counting the number of rows between each pair of months?
- How to create a conditional panel using a reactive object that is passed from another module?
- Plot multiple normalized stock charts from different dates into a single plot
- Select columns based on string match - dplyr::select
- Looking for a more efficient way to replace matrix elements
- modelsummary modelplot: change linewidth
- custom R function with group argument does not work while using the filter
- ggsurvplot function, risk table alignment problem
- plot running average in ggplot2
- Calling variable in df within function
- How to find position of running minimum (runMin) in a vector in R?
- Using httr2::last_response() in conjunction with purrr::possibly()
- Cropping a raster using terra does not return the expected extent
- Can janitor::clean_names be used on only certain columns in a data frame?
- Efficient way of row binding time series in a data.table, with correctly sorted timestamps
- Defining optional arguments in R when more complex function
- Can I change the cursor in plotly only when hovering over points?
- Issue Loading RStoolbox: "Cannot find proj.db" Error
- Filter CSV files for specific value before importing
- Matching the same lines from 2 different files and 2 columns
- Conditional coloring and outer borders in pdf KableExtra table in R
- How can I use observe
- Posterior predictive check for GAM (mgcv in R)
- Embed images in plotly tick labels
- Product of two beta distributions
- R: how to include a character between two repeted items in R?
- Categorizing data from 7 columns into 2